
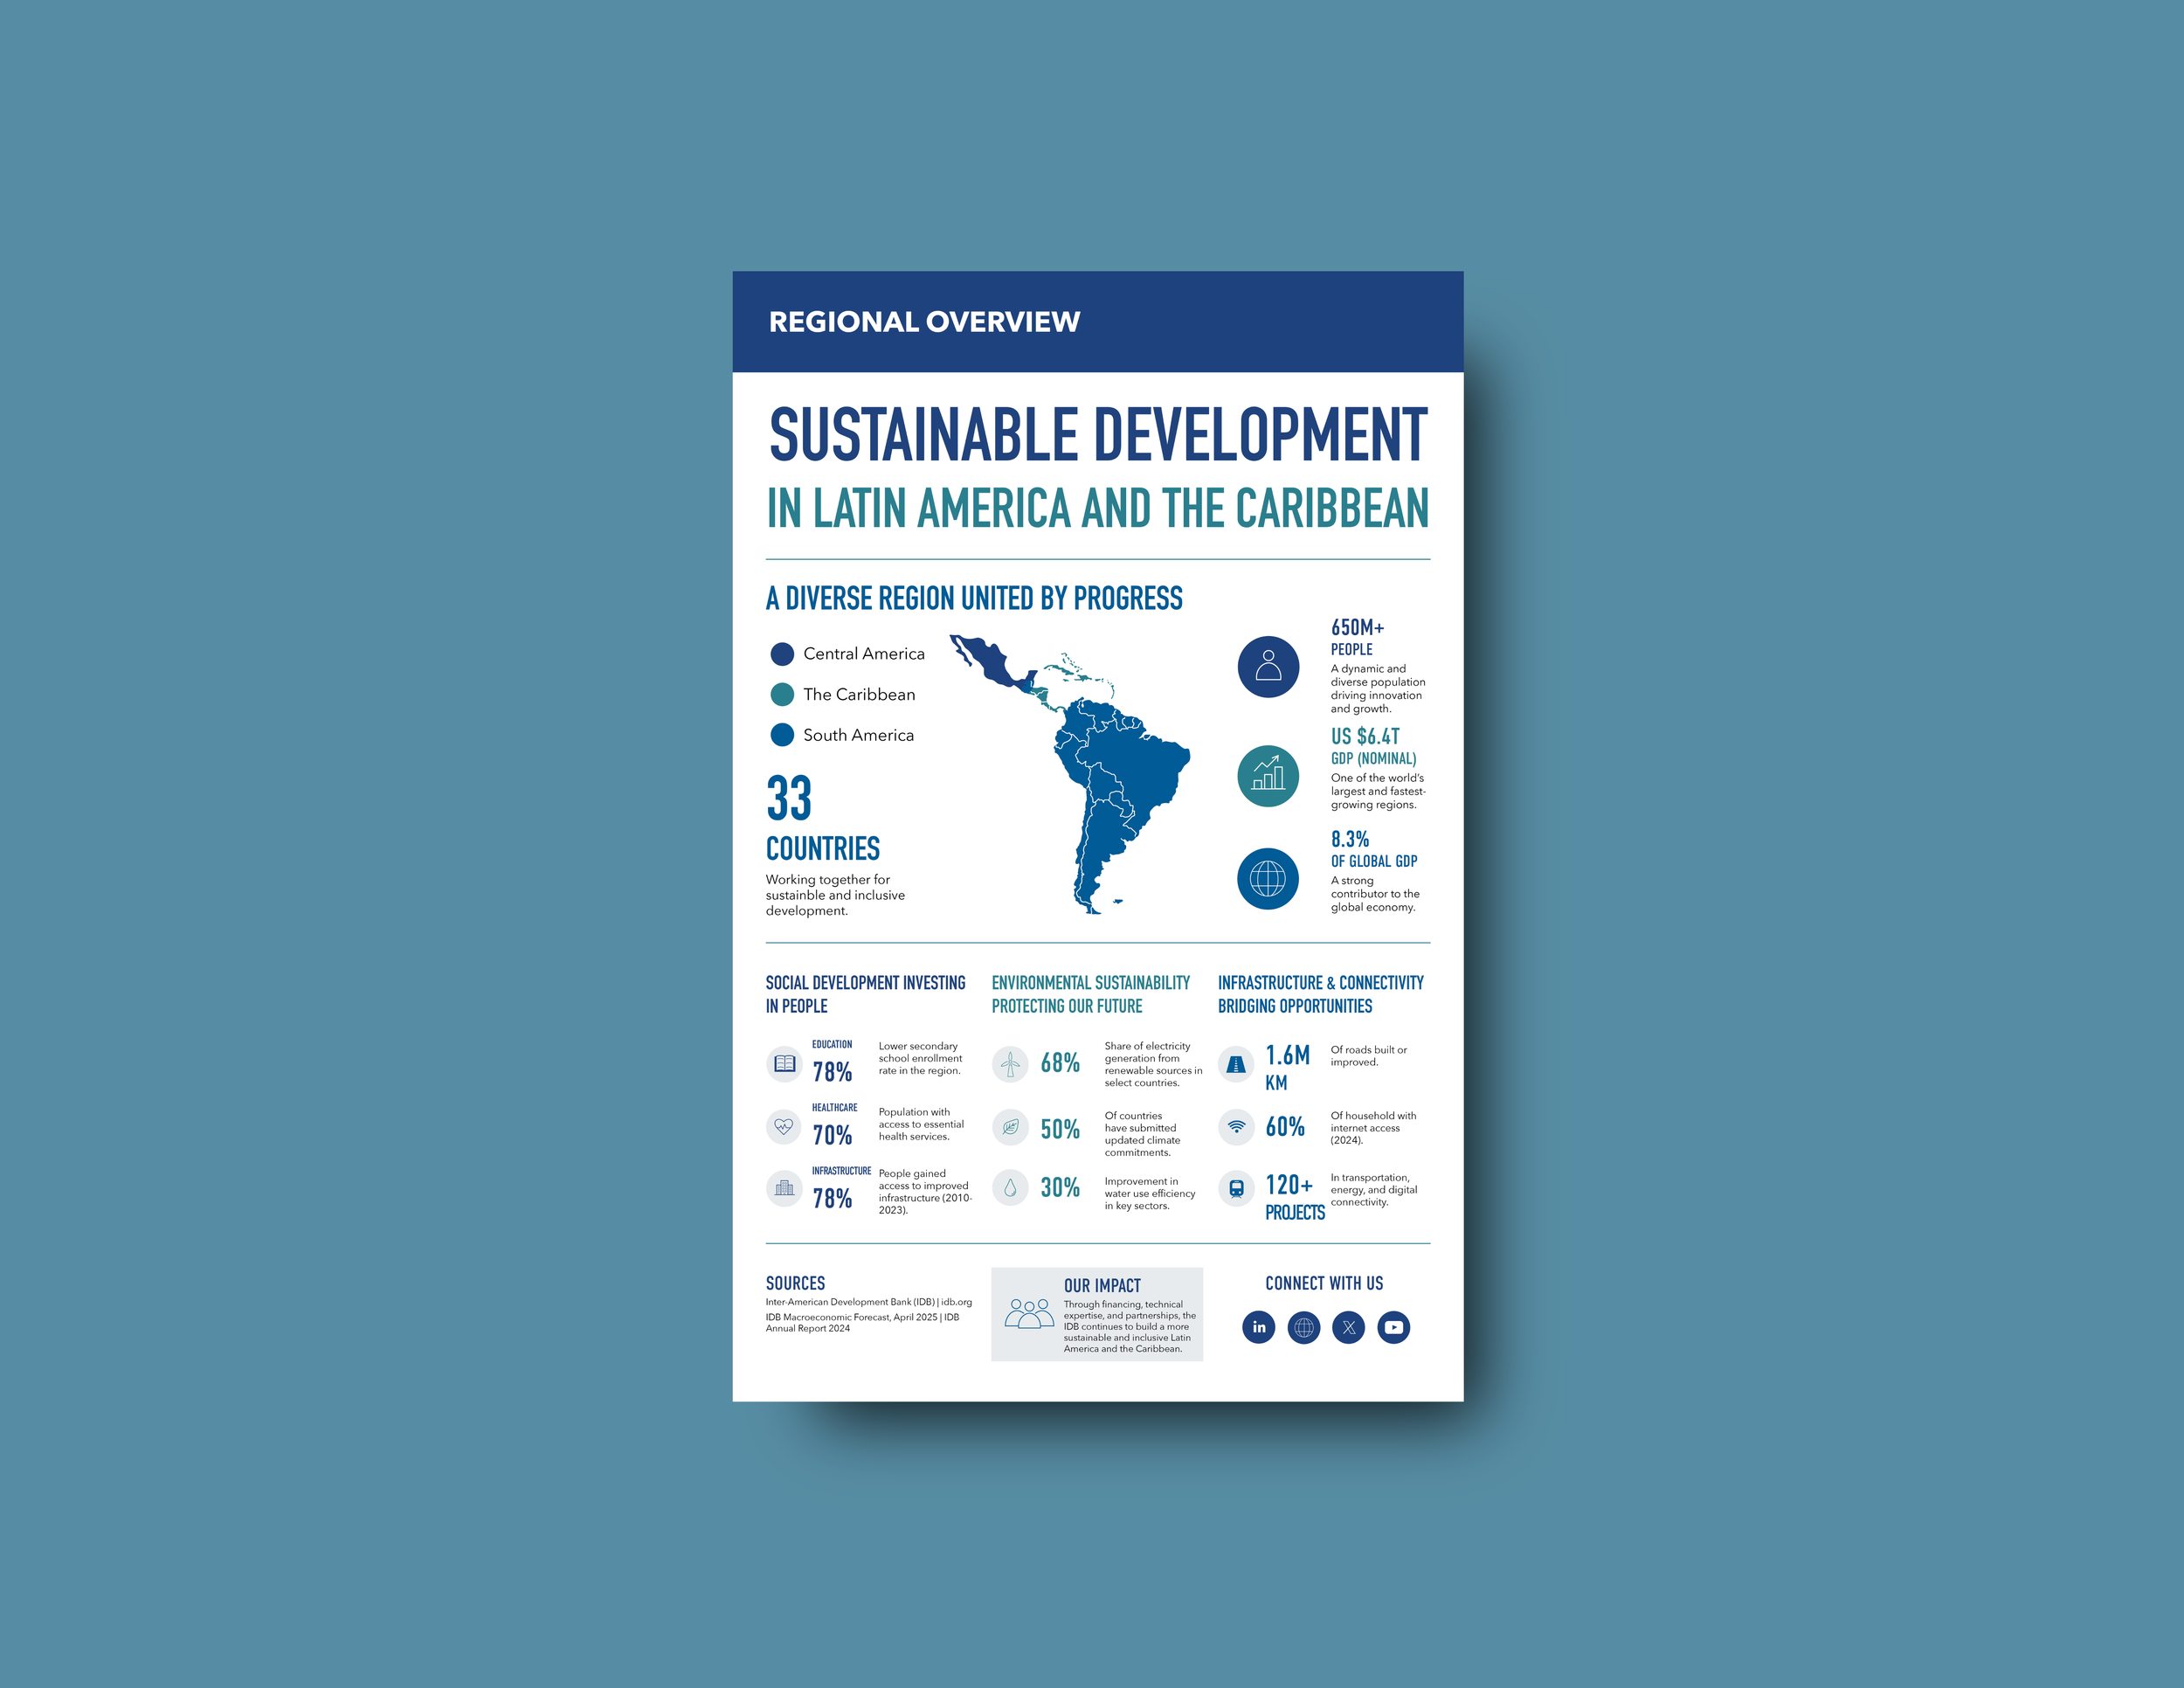
Sustainable Development in Latin America and
the Caribbean
Information Design • Editorial Design • Data Visualization
Project Overview
Sustainable Development in Latin America and the Caribbean is a conceptual information design project focused on communicating regional development indicators through a structured, single-page infographic. The publication brings together geographic mapping, statistical data, and custom iconography to present economic, environmental, and social information with clarity.
The design organizes multiple development indicators into a cohesive visual narrative, allowing readers to identify key figures, understand their context, and navigate related information efficiently.
Project Type: Information Design
Role: Information Designer
Deliverables: Editorial Infographic, Data Visualizations, Map Design, Icon System, Print Mockups
Tools: Adobe Illustrator, Adobe InDesign, Adobe Photoshop
Format: Print-ready CMYK System
Information Design System
I developed a modular layout that guides readers from a regional overview to key statistics and thematic findings. The map establishes geographic context, prominent numerical callouts highlight selected indicators, and distinct content sections organize the supporting information.
A restrained blue and teal palette, consistent typography, and custom iconography connect these elements while maintaining a clear reading sequence.
Original infographic layout integrating maps, custom iconography, and data visualization.
The Challenge
The challenge was to present multiple dimensions of sustainable development within a single-page format without overwhelming the reader. Economic, environmental, and social indicators needed to remain distinct while contributing to a cohesive regional overview.
My Approach
I prioritized geographic context and high-level findings before introducing more detailed information. Numerical callouts emphasize figures that can be understood individually, while thematic groupings provide the context needed to interpret related indicators.
Key contributions included:
Developing a modular infographic grid
Creating a regional map
Designing statistical callouts and supporting visualizations
Developing a consistent iconography system
Establishing typographic hierarchy and content organization
Preparing print-ready production files
The approach balances information density with the space and structure needed for effective interpretation.
Design System
The visual system was built around:
Modular editorial grid
Defined typography and numerical hierarchy
Geographic mapping
Custom statistical callouts
Consistent iconography
Blue and teal color palette
Standardized spacing and alignment
These elements provide a consistent framework for presenting multiple subjects within a limited page format.
Final Deliverables
11" × 17" Editorial Infographic
Executive headline system
Regional development map
Custom statistical callouts
Data visualization components
Icon-based information system
Print-ready CMYK artwork
Presentation mockups
Outcome
The completed infographic brings together geographic context, key indicators, and supporting research in a single editorial composition. The design demonstrates how thoughtful information architecture can make a broad, multidimensional subject easier to navigate without sacrificing the distinctions between individual topics.