
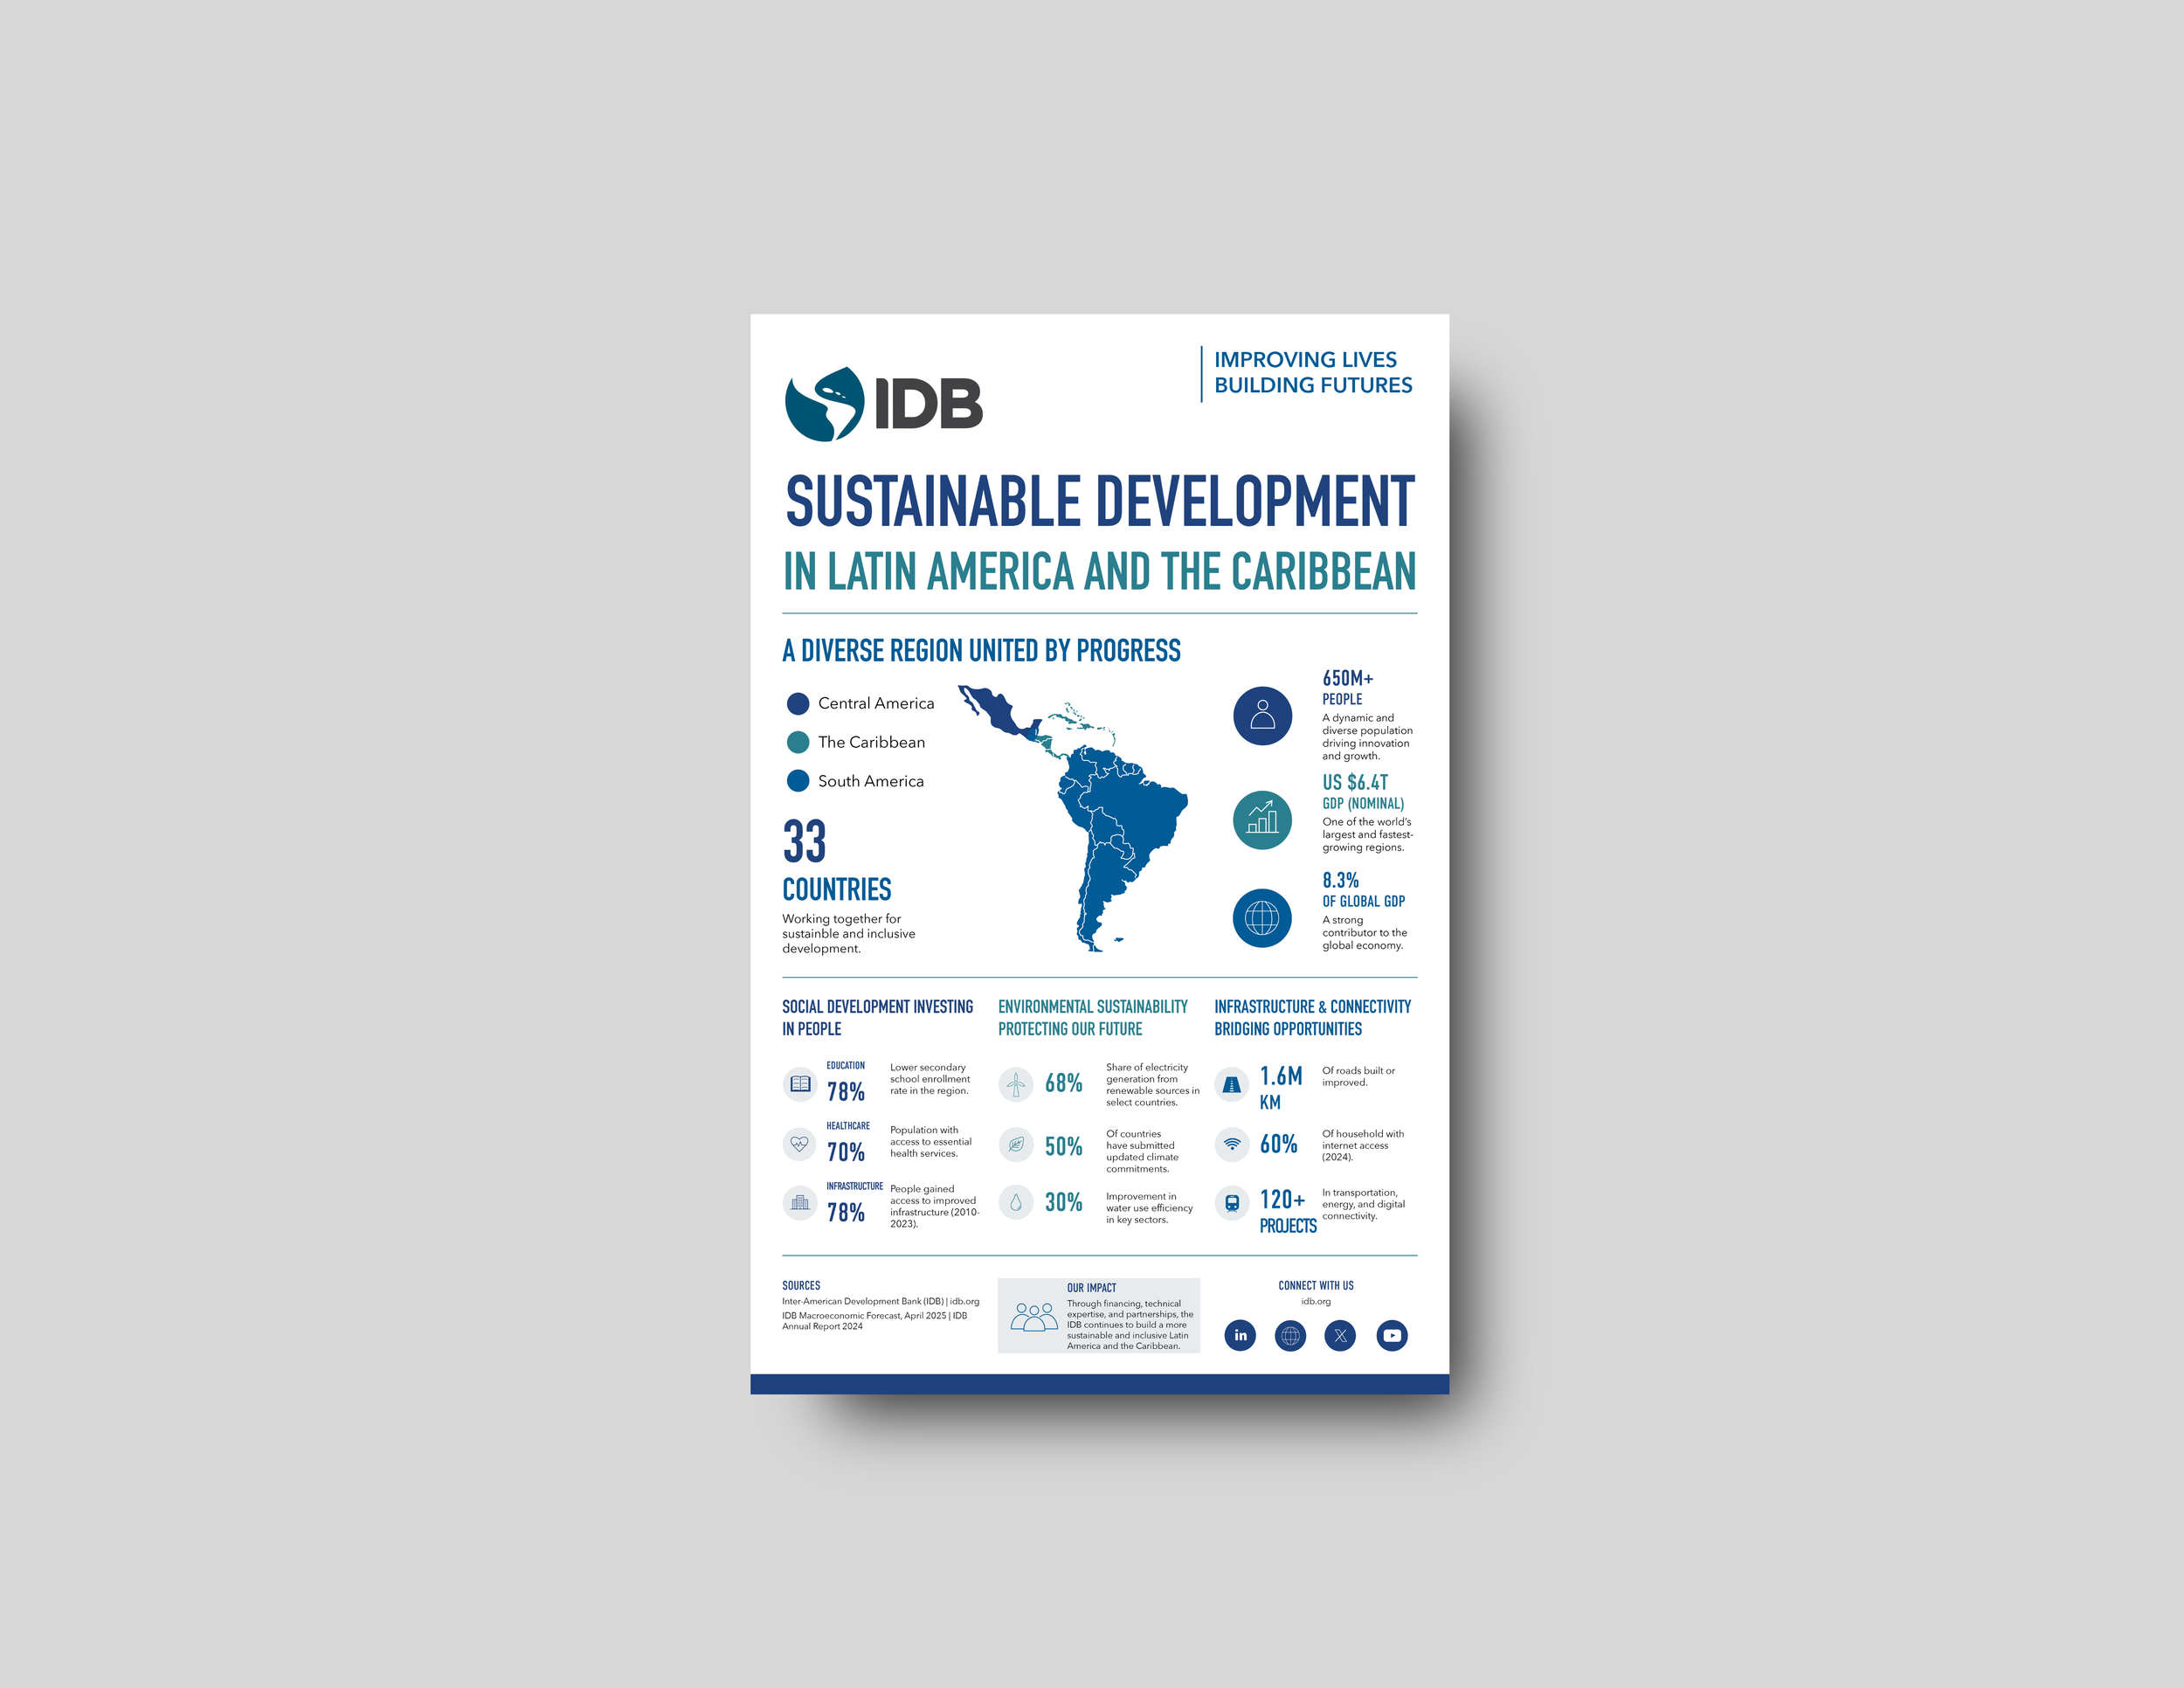
Inter-American Development Bank — Information Design
Information Design • Editorial Design • Data Visualization
Project Overview
The Sustainable Development in Latin America and the Caribbean infographic is a conceptual information design project developed for the Inter-American Development Bank (IDB). The piece was designed to communicate regional development indicators through a structured visual system that combines data visualization, editorial hierarchy, maps, and iconography into an accessible print publication.
The infographic translates complex economic, environmental, and social data into clear visual communication while reflecting the professionalism, transparency, and evidence-based approach associated with international development organizations.
Project Type: Information Design
Role: Information Designer
Deliverables: Editorial Infographic, Data Visualizations, Map Design, Icon System, Print Mockups
Tools: Adobe Illustrator, Adobe InDesign, Adobe Photoshop
Format: Print-ready CMYK System
Information Design System
The infographic establishes a structured information system inspired by institutional publications from international development organizations. Clear hierarchy, restrained color usage, and modular data visualization allow complex regional statistics to remain accessible and easy to interpret.
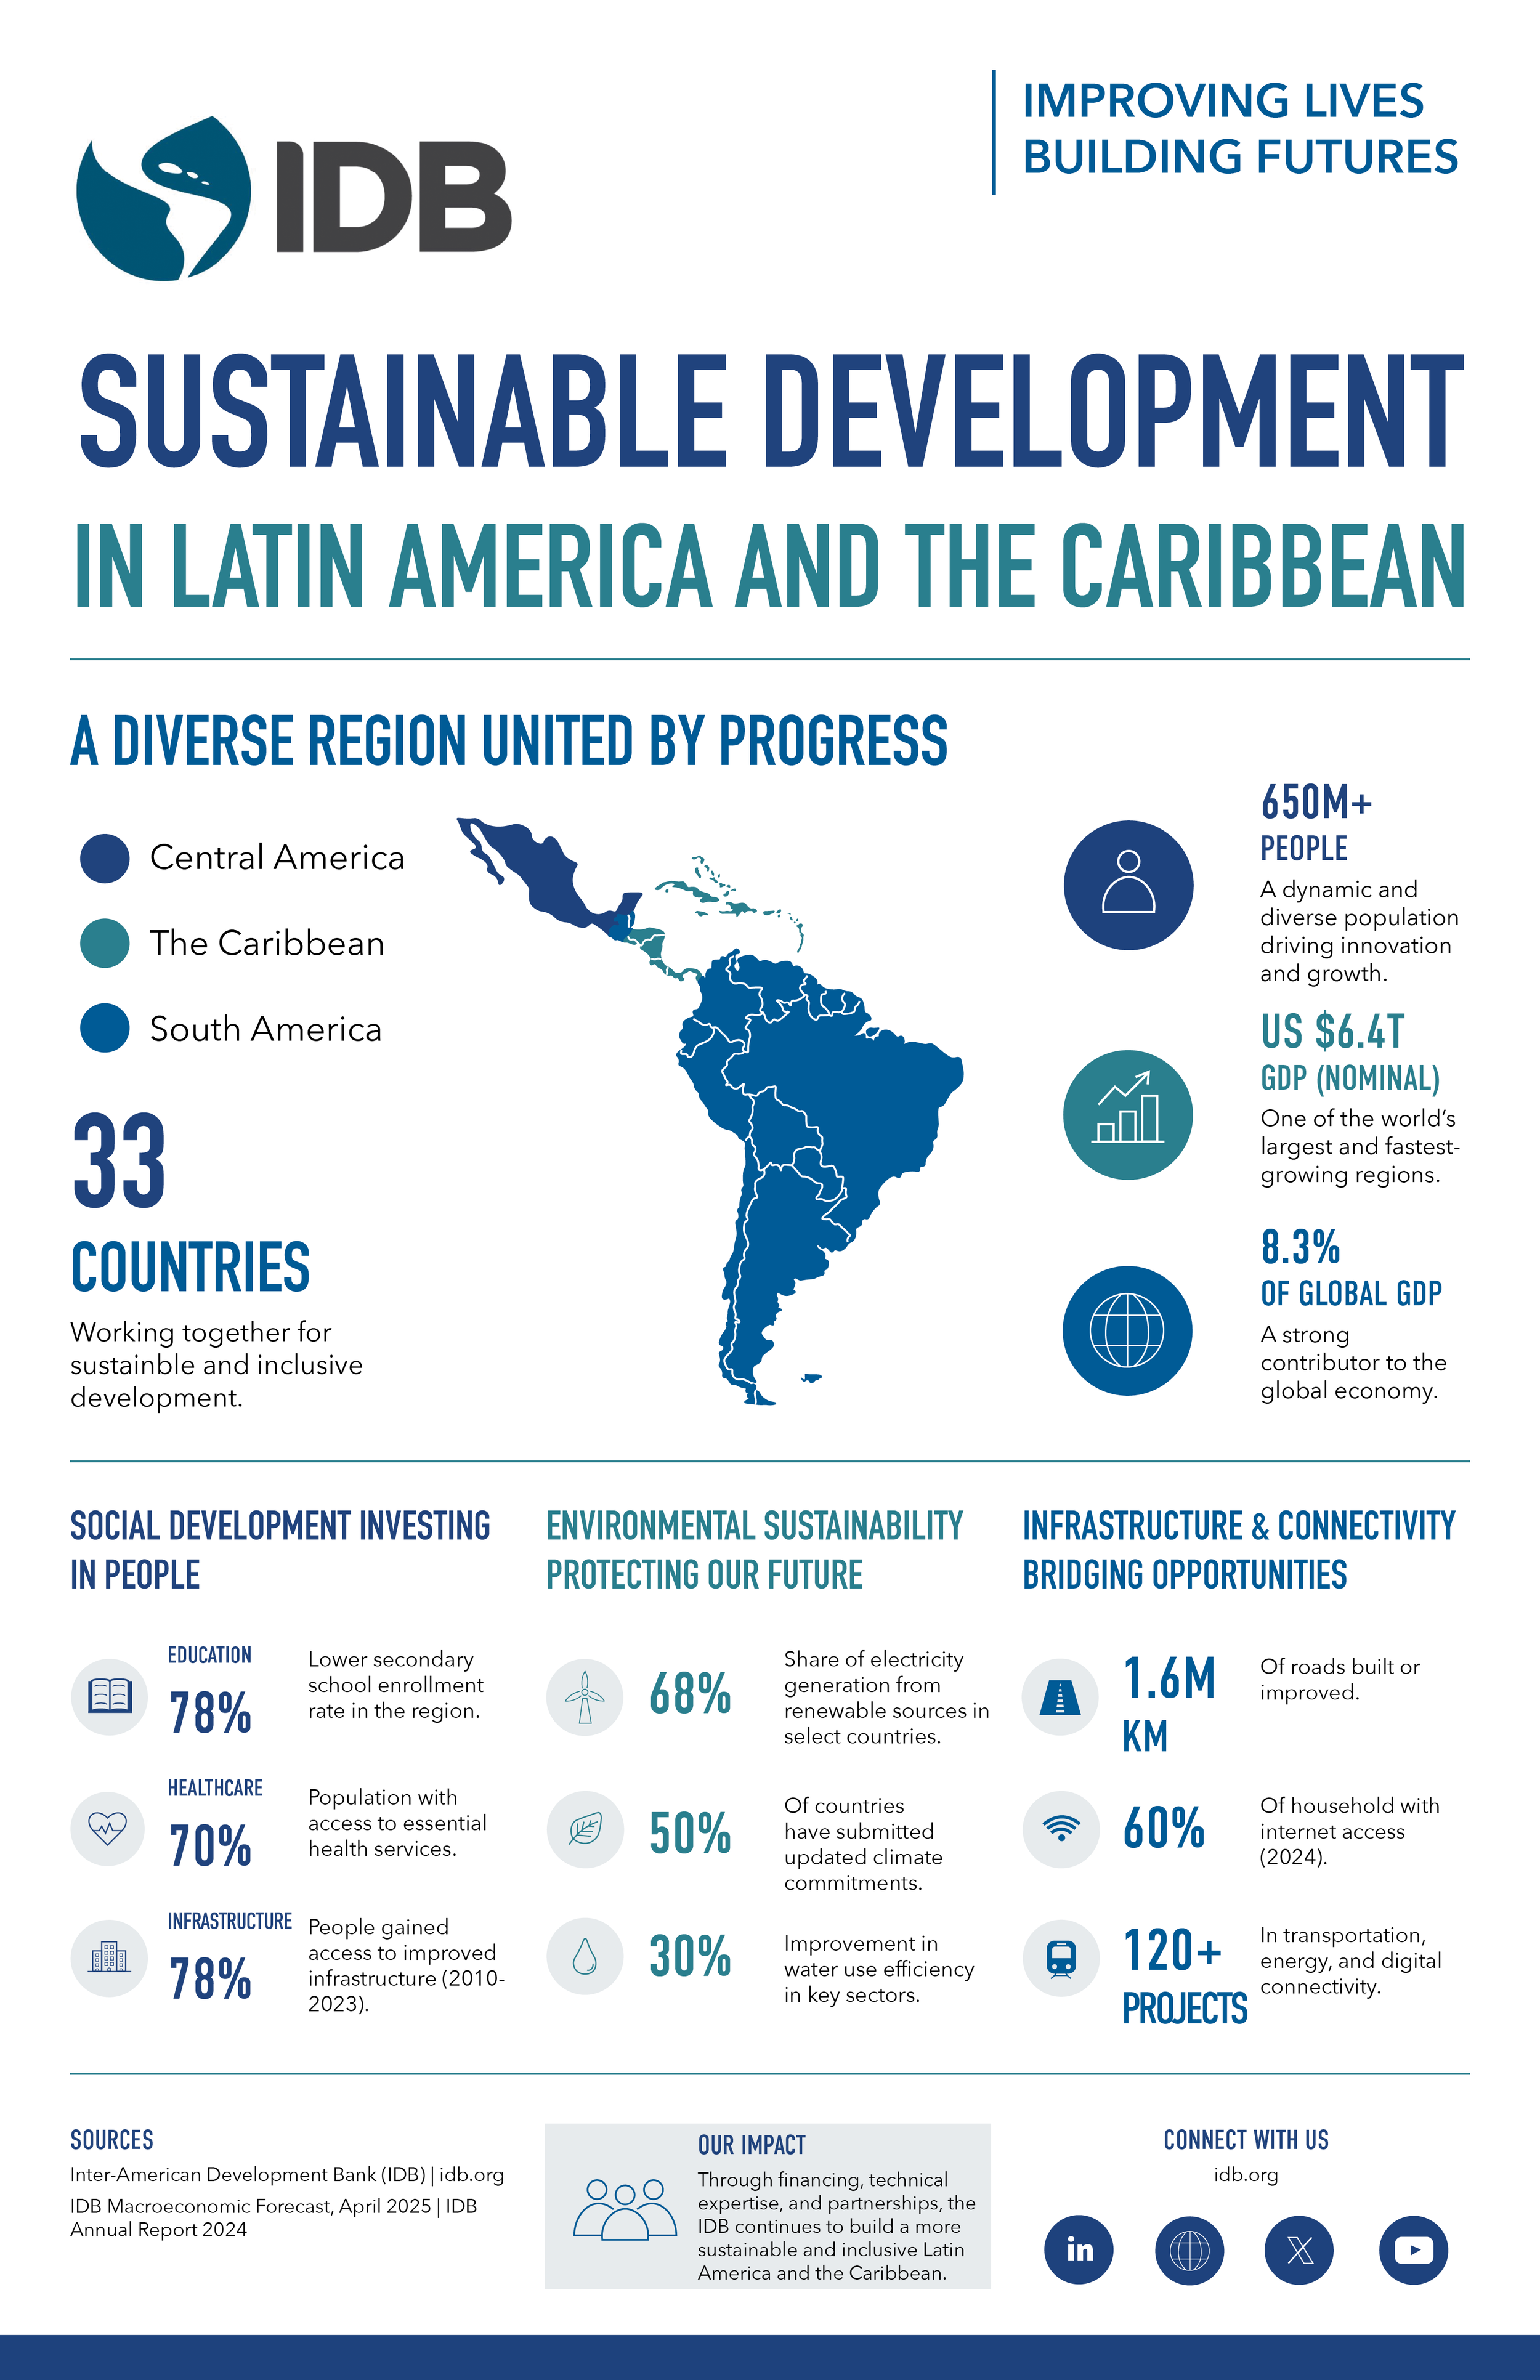
Original infographic layout integrating maps, custom iconography, and data visualization.
The Challenge
The challenge was to communicate multiple sustainable development indicators within a single-page format while maintaining clarity, hierarchy, and visual accessibility.
The infographic needed to organize demographic, economic, environmental, and infrastructure data into a cohesive information system appropriate for policymakers, researchers, educators, and international organizations.
My Approach
I designed a modular information system centered on editorial hierarchy, custom data visualization, iconography, and geographic mapping to simplify complex regional statistics while maintaining institutional credibility.
Key contributions included:
Developing a structured infographic grid
Designing custom statistical callouts
Creating an original regional map
Integrating iconography with supporting data
Establishing consistent visual hierarchy
Preparing print-ready production files
The final design prioritizes clarity, accessibility, and evidence-based communication while reflecting the visual language commonly used by international development organizations.
Design System
To communicate large volumes of information within a single page, the visual system was built around:
Modular information hierarchy
Custom data visualizations
Geographic mapping
Consistent iconography
Institutional blue and teal palette
Editorial typography system
Structured spacing and alignment
The resulting system improves readability while supporting quick interpretation of complex regional development data.
Final Deliverables
11" × 17" Editorial Infographic
Executive headline system
Regional development map
Custom statistical callouts
Data visualization components
Icon-based information system
Print-ready CMYK artwork
Presentation mockups
Outcome
The final infographic transforms complex regional development research into an accessible visual narrative through structured information design, editorial hierarchy, and custom data visualization.
The project demonstrates how information design can strengthen the communication of institutional research while maintaining the clarity and credibility expected from international development organizations.
Independent information design concept created for portfolio purposes only. This project was not commissioned by, affiliated with, endorsed by, or approved by the Inter-American Development Bank. Inter-American Development Bank, IDB, and related trademarks are the property of their respective owners.