
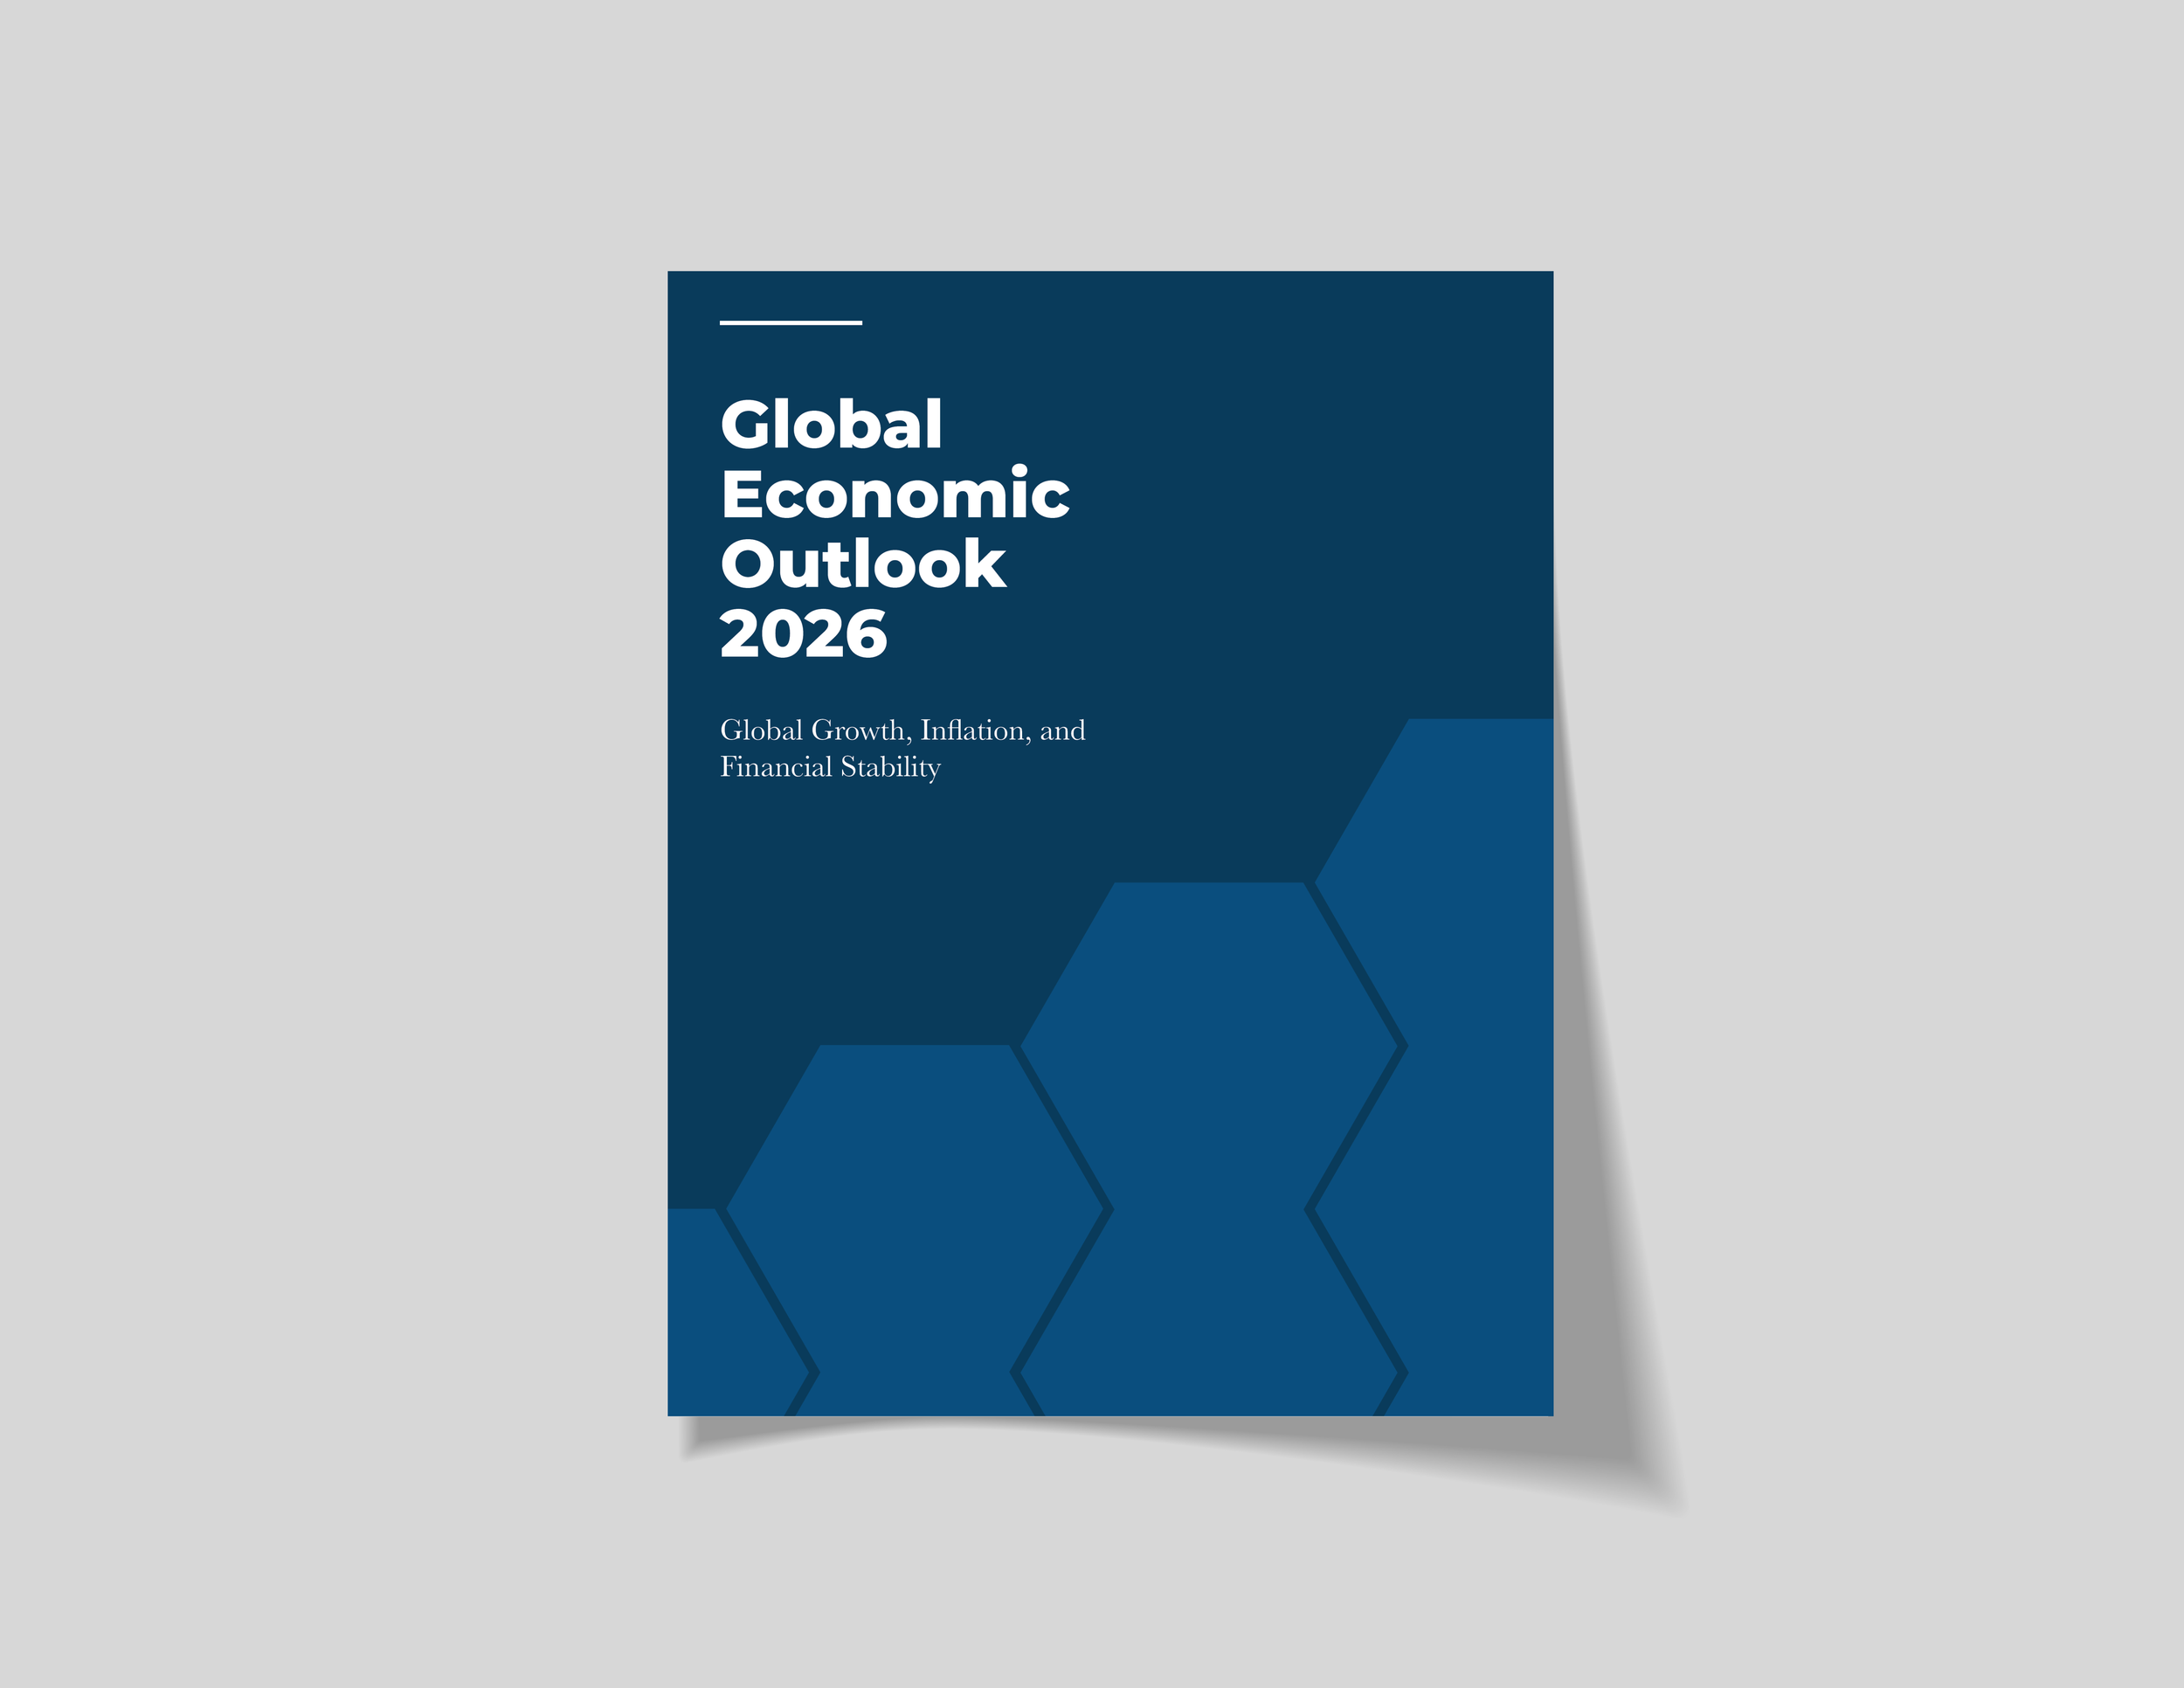
Global Economic Outlook 2026 — Editorial Design
Editorial Design · Information Design
Project Overview
Global Economic Outlook 2026 is a conceptual editorial publication exploring how economic forecasts, regional analysis, and financial indicators can be communicated through a cohesive visual system. The 12-page report brings together editorial design, data visualization, and photography to make complex information accessible to a professional audience.
Project Type: Editorial Publication Design
Role: Information Designer
Deliverables: 12-Page Editorial Report, Editorial Layouts, Data Visualizations, Charts, Cover Design, Print Mockups
Tools: Adobe InDesign, Adobe Illustrator, Adobe Photoshop
Format: Print-ready CMYK System
Editorial Publication System
I developed a consistent editorial system across the cover, table of contents, data visualizations, and supporting spreads. Structured grids, typography, and a restrained blue palette establish visual continuity while allowing each layout to respond to its content.
The report uses horizontal bar charts to compare projected GDP growth across economies. A shared baseline makes differences easier to evaluate, while the horizontal format accommodates longer geographic labels. A doughnut chart presents the relative shares of global growth, providing a complementary view of how different economic groups contribute to the total.
Regional analysis pages combine concise summaries, prominent figures, and contextual photography. The layouts establish a clear distinction between key findings and supporting information, allowing readers to scan the report efficiently or examine the content in greater detail.

Printed editorial mockup showcasing the publication's table of contents and overall navigation system.


Original editorial layout presenting the table of contents and publication navigation.


Editorial spread combining economic analysis with custom data visualizations.


Regional analysis pages presenting editorial layouts, photography, and supporting statistics.
Regional comparison spread with supporting statistics.


The Challenge
The challenge was to present economic forecasts, statistical indicators, and regional analysis within a publication that balanced analytical detail with visual clarity.
The content required different forms of presentation—from comparative charts to long-form analysis—without compromising readability or consistency across the report.
My Approach
I developed a modular editorial system using consistent grid structures, clear typographic hierarchy, and flexible page compositions.
I selected visualization formats based on the relationships within the data, using bar charts for direct comparisons and proportional graphics for part-to-whole information. I also established a consistent treatment of headings, numerical highlights, photography, and supporting text to guide readers through the publication.
Key contributions included:
Designing a cohesive editorial publication system
Establishing consistent page hierarchies
Creating custom data visualizations and charts
Organizing complex editorial content for readability
Integrating photography within structured layouts
Preparing print-ready publication files
The result is an editorial system that accommodates different types of information while maintaining a unified visual identity.
Design System
To maintain consistency throughout the publication, the editorial system was built around:
Structured editorial grid layouts
Defined typographic hierarchy
Restrained blue color palette
Custom charts and data visualizations
Consistent spacing and alignment
Photography integrated within editorial layouts
These elements provide a flexible framework for presenting statistical information, regional analysis, and editorial content without sacrificing clarity or consistency.
Final Deliverables
12-page editorial publication
Front cover design
Table of contents
Editorial article layouts
Chapter opening spreads
Custom charts and graphs
Data visualization system
Print-ready CMYK publication
Outcome
The final publication brings together economic analysis, data visualization, and editorial design within a cohesive visual system.
Consistent layouts, clear information hierarchy, and purpose-driven visualizations make the content easier to navigate and compare. The project demonstrates how editorial design can support the communication of complex economic information without compromising analytical detail.